Geography News
7th November 2025
KS3
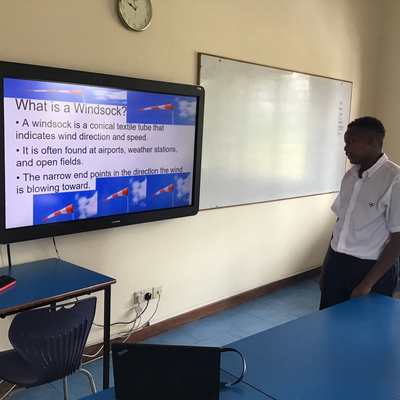
From thermometers to thunder, our KS3 Geographers turned “Elements of Weather” into a live show by measuring, explaining and debating extreme weather.
Real science, real skills, and really confident speakers.
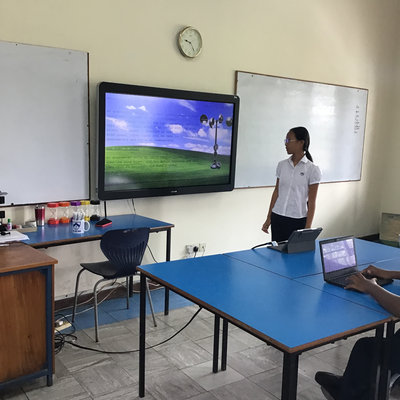
If the sky had a dashboard, Key Stage 3 just learned how to read it. In a fast-paced series of mini-talks, students unpacked the elements of weather: temperature, air pressure, wind speed and direction, humidity, cloud cover and rainfall; and the instruments that make invisible air behave like numbers.
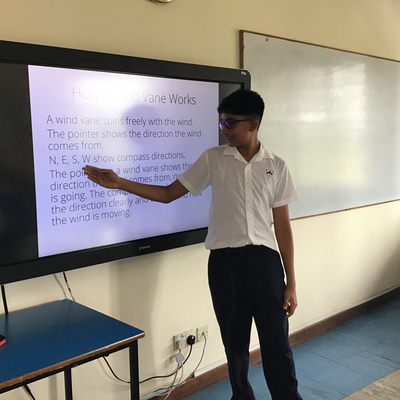
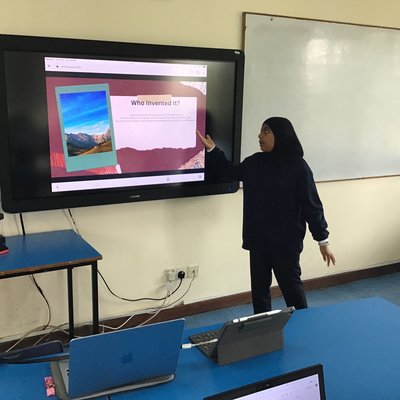
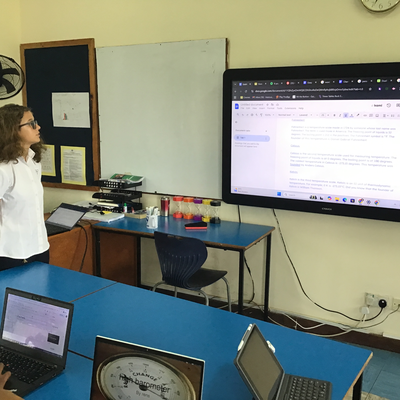
They started with the basics: thermometers for temperature (why shade matters), barometers for air pressure (how falling pressure hints at rain), anemometers for wind speed, wind vanes for direction (N–E–S–W is not just a compass, it is a story of where the air came from), rain gauges for precipitation, and hygrometers for humidity. One brilliant presenter joked that a wind vane is like the class gossip, always pointing to where the wind came from. Another showed how anemometer cups “count the spins” so we can compare a breezy day to a blustery one.
Then came the drama: extreme weather. Students connected data to events, how high sea-level pressure can lock in heat, how saturated air fuels downpours, and why rapid pressure drops warn of storms. They discussed smart choices, from checking forecasts before fieldwork to designing rain-safe school events.
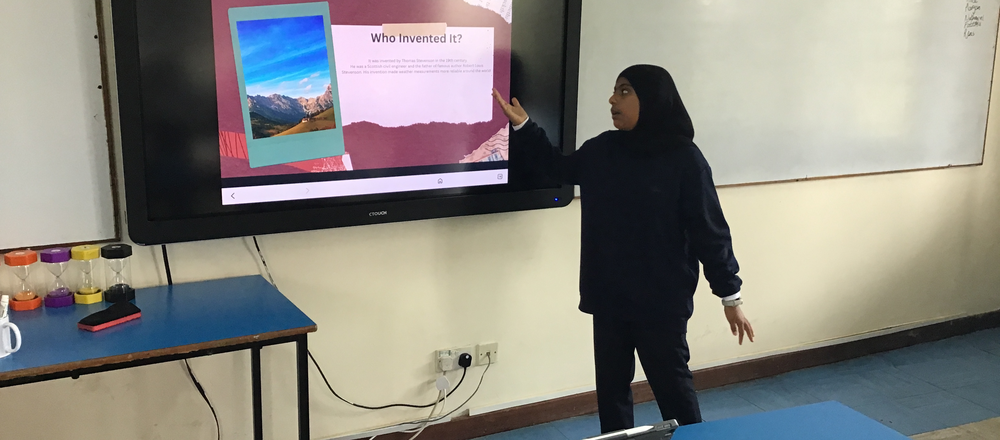
More than a science lesson, this was presentation craft in action. Students planned, timed, and delivered clearly, using slides, diagrams, and live pointing on the big screen. Along the way they practiced communication, teamwork, digital literacy, resilience (hello, slide 4 that didn’t load), and curiosity—the values that power great geographers and great people.
“Weather changes fast—but our skills stick.”
Geography Objectives Achieved
- Described and explained key elements of weather and their units.
- Apply concepts to extreme‑weather impacts and simple mitigation.
- Communicate findings using clear visuals and structured talks.
Toolbox
- Thermometer → temperature (°C)
- Barometer → air pressure (hPa)
- Anemometer → wind speed (m/s or km/h)
- Wind vane → wind direction (N, E, S, W)
- Rain gauge → rainfall (mm)
- Hygrometer → humidity (%)
Geo in Real Life-DID YOU KNOW WHY?
Why your picnic gets windy at the coast: afternoon sea breezes start when land heats faster than ocean, lowering pressure over land and pulling cooler air in from the sea.
KS4
From sketchbook volcanoes to storm‑hydrograph masterpieces, our KS4 geographers fused creativity with data skills—then used both to ask the big question: How do we forecast and mitigate floods?
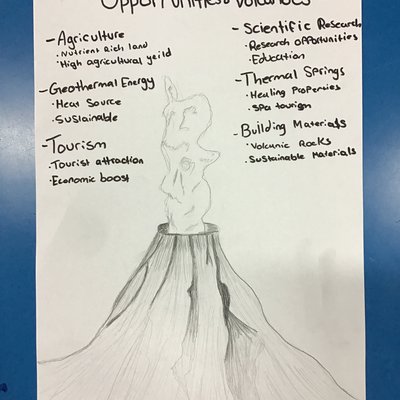
Volcanoes grabbed the headlines first. Students explored how plate boundaries create different eruption styles, from runny basalt flows to explosive ash columns. But this was not just hazard talk, learners mapped the opportunities too: fertile soils for agriculture, geothermal energy, tourism, local building materials, and thermal springs for health and research.
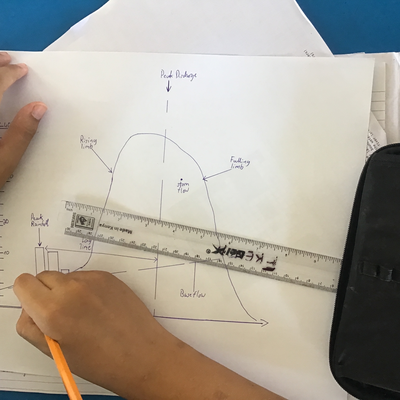
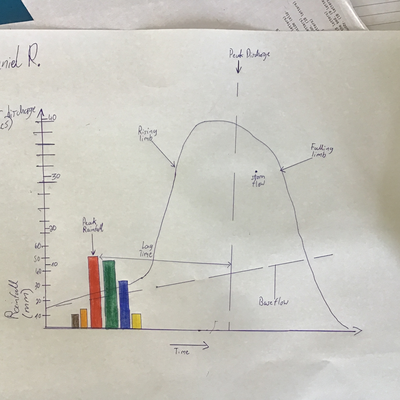
Then we pivoted to rivers. Using rulers, pencils and patience, learners constructed storm hydrographs by hand, plotting rainfall bars against river discharge to reveal the anatomy of a flood: lag time, rising limb, peak discharge, stormflow and baseflow. The aha‑moment? Seeing how catchment factors—urban surfaces, slope and soil saturation—steepen the rising limb and shrink the lag time.
“Good drawings aren’t just pretty—they’re predictive.”
Learners began with thumbnail plans (layout, axes, labels), moved to measured construction (consistent scales, neat bar spacing), and finished with annotation and shading to emphasise key features. Result: professional‑looking diagrams that communicate science at a glance.
Forecasts & Flood Mitigation
Hydrographs turn weather into warnings. When intense rainfall is forecast, a modelled hydrograph helps planners time alerts, open spillways, stage rescue teams, and protect infrastructure. Students evaluated mitigation options:
- Sustainable Urban Drainage Systems (SUDS): permeable paving, swales, rain gardens to slow runoff.
- Afforestation and contour ploughing to enhance infiltration and reduce overland flow.
- River engineering where appropriate: levees, detention basins, channel re‑alignment, spillways.
- Zoning and floodplain mapping to keep people and assets out of harm’s way.
KS4 Objectives Achieved
- Explain volcanic processes and weigh hazards vs. opportunities for people and place.
- Construct, label and interpret a storm hydrograph, relating form to physical & human factors.
- Evaluate flood‑mitigation strategies and link them to forecast lead time and risk reduction.